Everyone’s been raving about the popularity of web video this year, but a less talked-about form of visual content—interactive websites—can be way more engaging. These sites draw the viewer inside rich stories with stunning photography, videos, words, and interactive elements that create a stimulating personal experience.
These are some of the best and brightest stars in a constellation of excellent interactive websites (we’re spending a lot of time in the dark this time of year—apologies for using a ridiculous metaphor). Anyway, these are some of the things we think a really good interactive experience should do:
- Make massive amounts of data accessible and relatable
- Inform or entertain
- Use interactivity to create a distinct experience for each viewer
- Create an emotional connection that static content wouldn’t have
Here are 24 of our favorites, as nominated by the folks around the Visually office. This includes a mix of interactives from news media, brands, geopolitical organizations, and designers who are just doing it for fun. If you really want to dig deep, you can also check out a complete list of our staff picks from the Visually Community.
We tried to be impartial, but since we produce some interactive websites that we’re pretty proud of, a few snuck onto the list. We’ve called out the ones we worked on below.
Time: A Year In Space
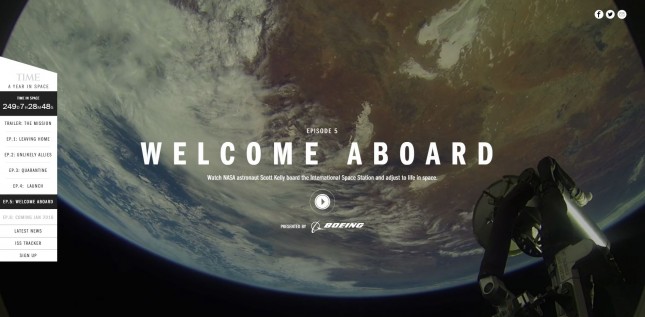
Important because: This interactive website profiles NASA astronaut Scott Kelly’s trip to the International Space Station and his time in space throughout 2015. It’s presented in episodes, making it easy to navigate the journey in chunks. The images are visually stunning, and the subject matter stirs the childlike spirit of exploration in all of us. The cherry on top is when the site breaks down the fourth wall by showing you where the International Space Station currently is, then explains how to walk outside and spot it in the sky.
Best interactive qualities: Dynamic backgrounds lead into video segments documenting Kelly’s travel and work. A navigation panel on the left-hand side of the page makes clicking from section to section easy, and it’s also got the sort of real time telemetry you’d expect from NASA.
Land Rover: The Vanishing Game
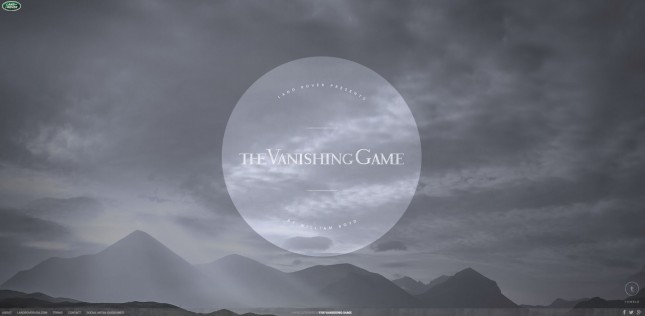
Important because: This interactive brings to life a written story by author William Boyd. It describes itself as “an adventure told by using the incredible techniques of the digital and social age.” Translated, that means it’s an interactive video where the viewer has control over the stimuli they receive. Remove the imagery, read a scrolling script, listen to the narrative, or shut it all down for a silent film.
Best interactive qualities: Limited navigation buttons leave the focus on stunning visuals and the storyline. The content changes as the reader scrolls ahead–allowing the viewer to set their own pace.
TSN: Favela United

Important because: This true story from Brazil’s impoverished favelas profiles tough young women who’ve been shaped by soccer culture. Great reporting with dramatic transitions, and stunning visuals.
Best interactive qualities: The story weaves a powerful human narrative with profound statistics. This mix of quality reporting, photography, and design is totally gripping.
NPR: A Girl Can Dream
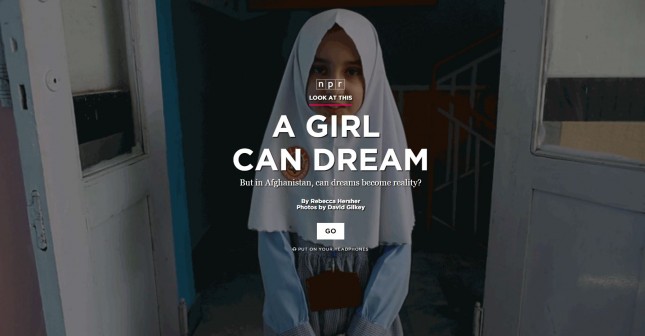
Important because: NPR pairs audio, video and an interactive storyboard to take viewers on a trip to a school in Afghanistan for an up-close look at the challenges facing women in the education system.
Best interactive qualities: Still frames are blended together to create animation that moves the story forward. Text is broken into small chunks which are overlaid across the bottom of images to create an easier reading experience.
Cohn & Wolfe: Cholesterol Counts
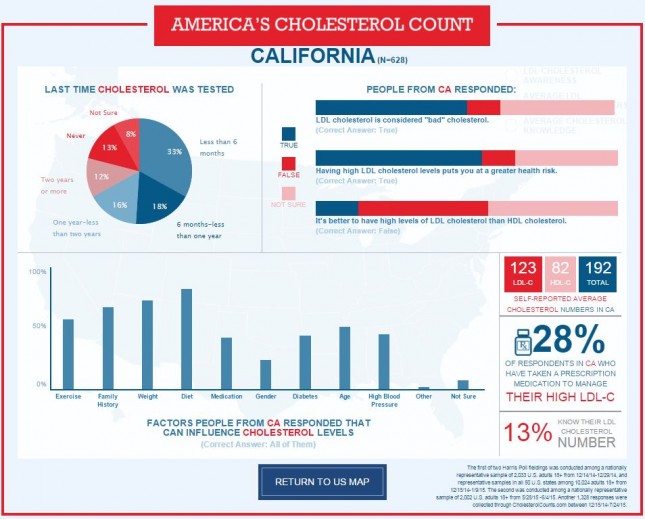
Important because: This explanatory content takes readers state by state through statistics about cholesterol-related issues (from average cholesterol levels to awareness and education). Full disclosure: Visually produced this content.
Best interactive qualities: A clickable map brings this story to life, and separate data visualizations for each state make the story consistent and engaging.
Photo World: How Big Is Snapchat?
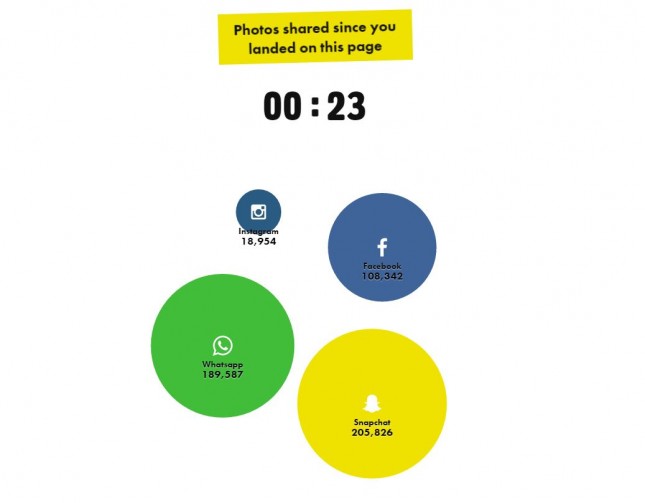
Important because: This interactive is sheer fun. By showing how many more images are shared on Snapchat every second relative to WhatsApp, Facebook, and Instagram, the scope of content creation on each platform becomes quickly apparent.
Best interactive qualities: A timer ticks up, second by second, as the total number of photos shared per social platform grows. This adds a sense of urgency to the page and immediately makes the content relevant to the viewer.
JLL: The Square: TECH
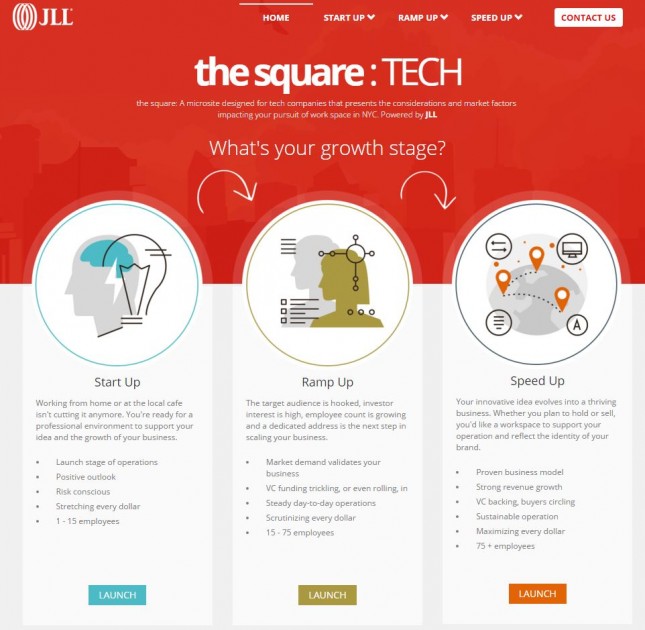
Important because: This choose-your-own-adventure style interactive is designed to help startups look for office space in New York City. Users profile themselves, then get a barrage of data to help them understand how to find the right HQ. Full disclosure: Visually produced this content.
Best interactive qualities: The division of content into buckets makes content approachable even for real estate outsiders. The combination of data visualization and checklists make the information look slick while it stays actionable.
Jason Davies: World Airports
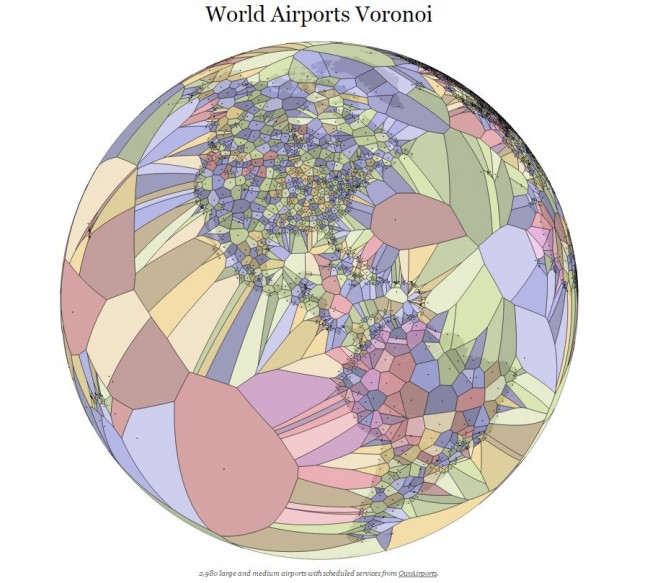
Important because: You always wanted to know where the world’s airports operate relative to population centers. Eh? OK, fine. It’s important because it looks cool.
Best interactive qualities: Hover over any section of the globe to learn which airport serves each region. Click and hold to spin the globe and discover transportation hubs you never knew existed.
Population Reference Bureau: 2015 World Population Data Sheet
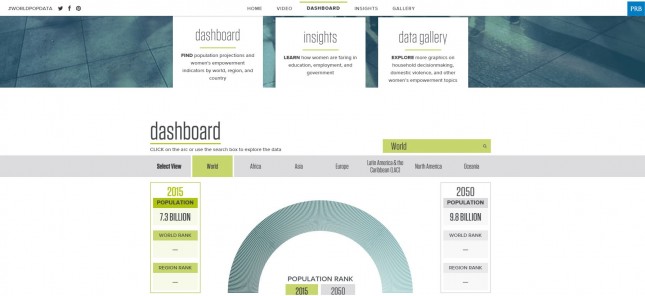
Important because: This interactive highlights the opportunities and challenges facing women worldwide. It’s a flood of important data, channeled neatly into a series of videos and interactive charts.
Best interactive qualities: Navigation is contained to a single scrolling screen with tons of clickable buttons to display data that compares 2015 and projected 2050 statistics on global population, fertility, education, and more.
The New York Times: Is It Better to Rent or Buy?

Important because: No matter where you live in the U.S., this collection of data-driven tools will help you make sense of the mortgage-versus-lease debate.
Best interactive qualities: Sliding scales allow the user to select from a host of data points—number of years in a location, home price, future projections for rent growth and more—to bring clarity to their decision to rent or buy. A calculator on the right-hand side of the page is set in place, allowing the reader to see how changes to the various inputs can impact their home-buying outlook.
Zazzle: 10th Anniversary
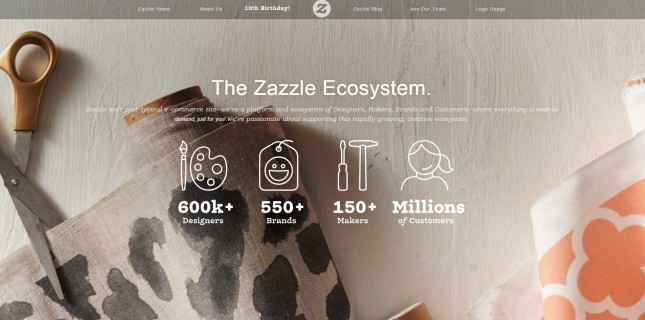
Important because: A platform for makers and designers to launch and sell custom products (without having to produce them themselves), Zazzle tells its story in this rich experience that’s part timeline and part data-driven explainer. Full disclosure: Visually produced this content.
Best interactive qualities: The viewer sees a vivid stream of designs that have been produced on Zazzle, combined with stats that explain the company’s impact. Images and stories from real-life customers add depth and underscore the value of working with Zazzle.
23 and Me: 23 Pairs of Chromosomes. One Incredible You.
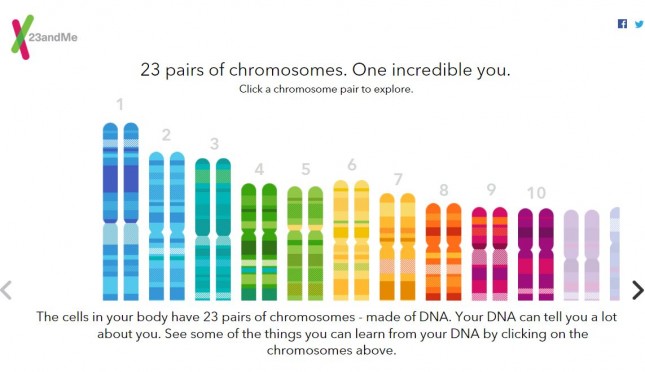
Important because: If you didn’t pay attention in science class during the section on genetics, you might actually learn something here. Full disclosure: Visually produced this content
Best interactive qualities: Colorful chromosome pairs are clickable and reveal information on the ancestry and genetic diseases associated with each. Bonus points for being responsive.
Saxum: U.S. of Energy
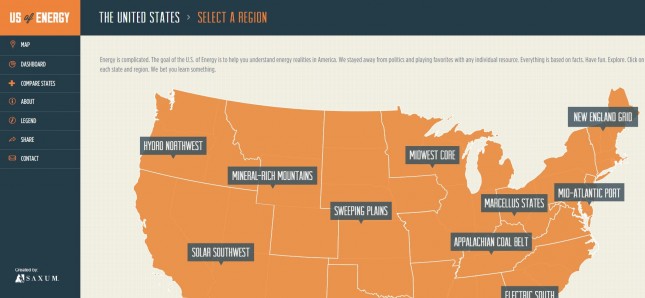
Important because: This interactive makes it easy to learn a lot about energy production and consumption in the US. You start by viewing broad trends over wide areas, then drill down to see detailed info for each state.
Best interactive qualities: A clickable map is paired with comparison tools to let you find the most relevant information, then give it context.
Targeted Victory: 50 States of Waste
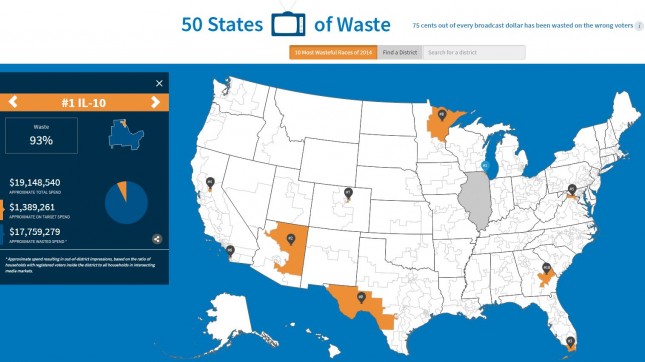
Important because: If you’re a politician or political organizer, this one will make you squeamish. This interactive shows how small the impact of political TV advertising actually is. Full disclosure: Visually produced this content.
Best interactive qualities: Data visualizations overlaid on a U.S. map reveal the statistic that 75 cents out of every broadcast dollar has been wasted on the wrong voters. Yikes.
Martin Ollivere: Who Hogs the World’s Wealth?
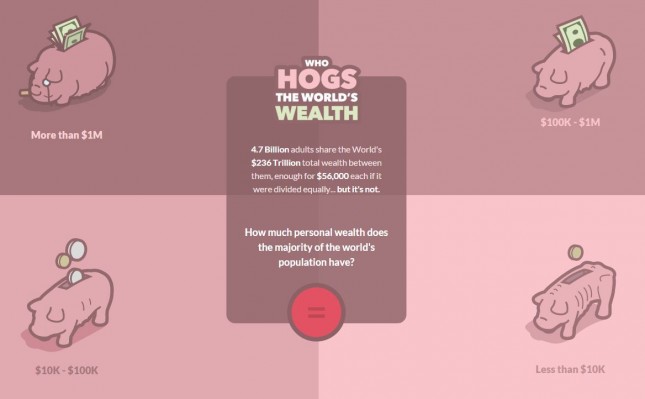
Important because: We often hear about income inequality, but this visualization makes the topic meatier by breaking it down with a visual pig metaphor.
Best interactive qualities: Simplicity makes this interactive go. The shifting square grid is easy to grok, and the careful use of numbers tells the story of disparity clearly.
Lynn Fisher & Nick Crohn: Airport Codes
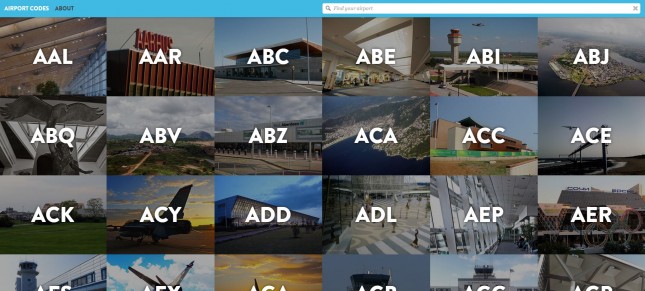
Important because: You’ll now be able to interpret all of the weird acronyms on your boarding pass. Bottom line, this is nice design that might help you win on Jeopardy some day.
Best interactive qualities: We love the comprehensive nature of this interactive, which features airports from around the world. Click any tile to learn interesting facts. Be sure to click the “About” tab for a well-selected GIF featuring Leslie Nielsen and the flight crew from Airplane!
BBC Future: Journey to the Centre of the Earth
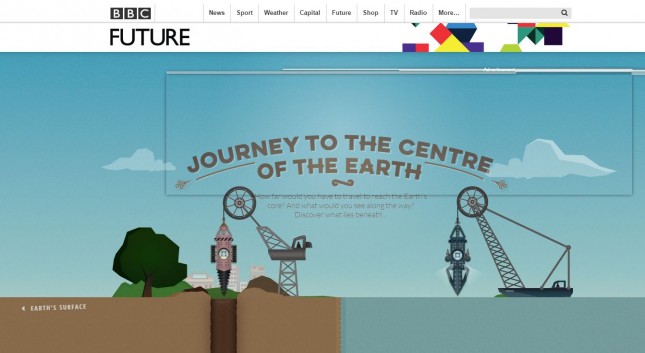
Important because: As a kid, you probably dreamed about digging a hole to the other side of the world from your backyard. This interactive actually lets you do that, in a way. You’ll journey to the earth’s core and learn a ridiculous number of facts about what you’d find along the way.
Best interactive qualities: Put on your steampunk gear and go below ground to learn about the standard depth of graves in western culture, the distance to which a penguin can plunge, and much more. We love the illustrated diving vehicle, the data points scattered along your path to the core, and the way the scenery changes as you scroll lower. This one’s pure fun and really interesting, too.
PartyPoker: Your Brain on Poker

Important because: Your geeky science self will love these illustrations depicting how the brain functions depending on poker skill level—beginner, amateur or expert.
Best interactive qualities: Not only can you look at images of the brain in action, you’ll also flip over cards, watch explainer videos and read tips about how to psych out your competition at the table.
UNESCO Institute for Statistics: Left Behind
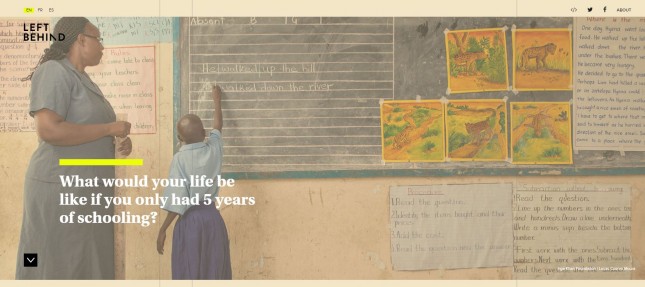
Important because: As we’ve already noted, many of the best interactives this year focused on key issues facing women throughout the world. This interactive is equal parts education and advocacy. Together, we can help promote education globally.
Best interactive qualities: Dive into the story and you’ll discover navigation dots in the left-hand margin of the page. You’ll view photos of real people, view charts in the context of explanatory text and, finally, learn how you can make a difference. The use of the #leftbehind hashtag encourages continuing conversation on social media.
ElkanoData: Fans on the Move
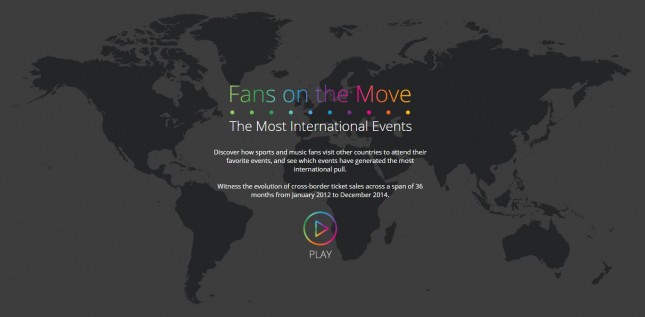
Important because: Entertainment becomes a global sport in this stunning visualization of the world’s most popular events based on international ticket sales, from sports to concerts to theater.
Best interactive qualities: We love the fact that once you launch this interactive, it’s off and running. Arcs show who purchases tickets to the Super Bowl, for example, and data instantly pops up to reveal how many fans left their country to travel to the event, which locations represented the top countries of origin and so on. Let the data flow over you, or stop it to get a detailed snapshot.
Big Group: Oscar Dresses
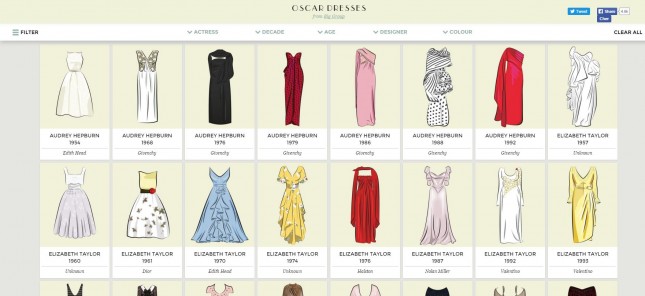
Important because: You know you watch those award shows on TV just to see which style trends you’re missing out on (and to poke fun, in some cases).
Best interactive qualities: Click on any dress from 1954 on and you’ll get to view a larger version of the style that made its respective celebrity shine. We love the bold social sharing icons at the top of each popup box and the clean presentation. Fewer bells and whistles can make for a more appealing presentation,.
The Washington Post: Majority Illusion
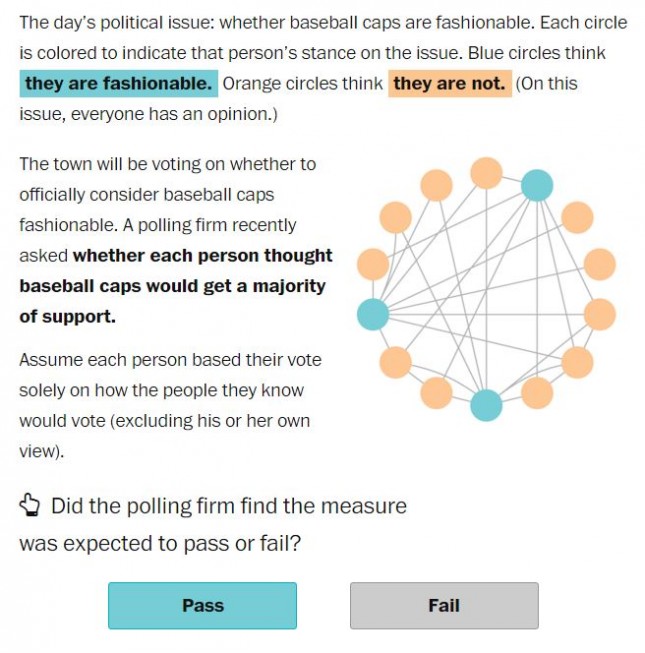
Important because: The interactive quiz question in this news article shows us how little we really know about the nature of influence and popular opinion on any subject.
Best interactive qualities: The use of a quick interactive at the top of this news story engages the reader early on and encourages further reading and digestion of data visualizations. It also makes the story personal by demonstrating the social phenomenon it describes.
WBEZ, Curious City: Bus Bunching
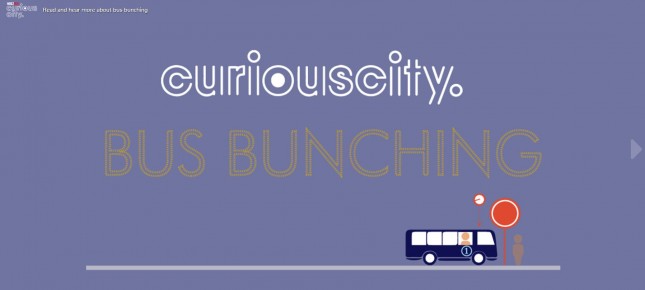
Important because: Channel your frustration over long public transportation wait times into this humorous yet educational interactive.
Best interactive qualities: Clickable arrows let the reader navigate forward and backward in the story, which goes step by step to explain how bus schedules naturally get messed up. It goes on to suggest solutions to the problem—all while making clear each would still probably make riders upset. We loved the way this interactive makes sophisticated concepts accessible and creates an emotional connection.
UNESCO Institute for Statistics: Out-of-School Children
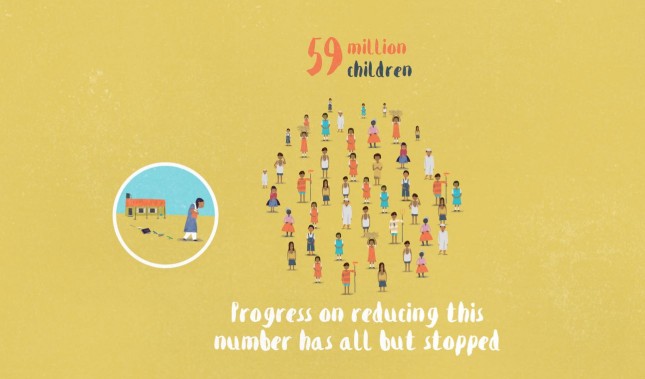
Important because: This interactive addresses the problem of children who are prevented from accessing the education they need to further themselves, support a future family and give back to their community.
Best interactive qualities: An animated introduction sets the stage for the viewer, after which clickable buttons along the right rail provide a glimpse into the education gap in individual countries. Data points break down education inequality by location (rural and urban), gender, and relative wealth. With each click, animated children run backward and forward across the page, stressing the point that these are real people with real dreams that aren’t being met.
Looking for more inspiration? See some more of our favorite interactive visualizations, or subscribe to our newsletter to get updates on the rest of 2015’s best visual content.
The post The 24 Best Interactive Websites of 2015 appeared first on Visually Blog.
from Visually Blog
http://blog.visual.ly/24-best-interactive-websites-2015/
No comments:
Post a Comment